
The primary purpose of this newsletter is:
- to review the actuarial valuation information and contribution requirements of the 1999 Academic Pension Plan as at Dec. 31, 2025
- to review investments and investment performance of the plan in 2025
- to report on the activities of the Academic Defined Benefit Pension Plan Committee (ADBPC)
- to review 2025 performance and look at the market outlook for 2026
Pension Plan Information
Market value of pension plan assets
as of Dec. 31, 2025
|
Fund
|
2025
|
2024
|
|
| Global Equities | $23,915,000 | $21,875,000 | |
| Global Low-Volatility Equities | $20,045,000 | $18,131,000 | |
| Total Equities | $43,960,000 | $40,006,000 | |
| Bonds | $102,390,000 | $104,438,000 | |
| Real Estate | $16,199,000 | $20,485,000 | |
| Total Fixed Income | $118,589,000 | $124,923,000 | |
| Total market value | $162,549,000 | $164,929,000 | |
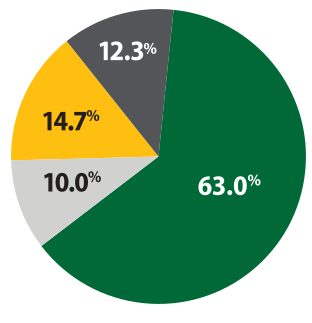
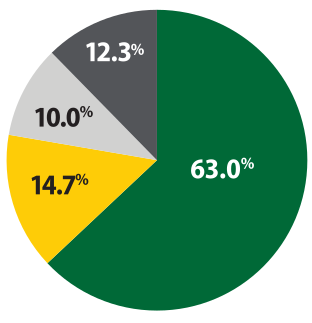
Distribution of assets among investment managers
as of Dec. 31, 2025
|
Investment Manager
|
2025
|
|
| BlackRock Asset Management | $102,390,000 | |
| Arrowstreet | $23,915,000 | |
| TDAM Epoch | $20,045,000 | |
| TD Greystone | $16,199,000 | |
Investment performance
The long-term investment goal of the plan is to achieve an annualized total rate of return that supports the funded status of the plan. To achieve this goal, the plan has adopted a balanced asset mix with a bias to fixed income to attain the targeted investment return. The responsibility for investing the assets of the plan has been delegated to four professional investment fund managers with different mandates to ensure adequate investment diversification.
The plan’s return benchmark is a performance standard developed by the plan’s investment consultant, Aon. The Academic Defined Benefit Pension Committee and the Board of Governors have approved the benchmark. The investment fund managers of the plan are expected to meet or surpass the benchmark.
Funds
| Investment Performance | 2025 | Last four years | Last 10 years |
| Return* | 5.8% | 3.4% | 5.6% |
| Benchmark | 4.6% | 3.0% | 5.8% |
*Gross of fees
Membership data
as of Dec. 31, 2025
Active members
Pensioners and beneficiaries
Other members
deferred, pending transfers, transfer deficiency holdbacks
Total membership
| 2025 | 2024 | |
| Active members | 23 | 26 |
| Other members | 9 | 9 |
| Pensioners and beneficiaries | 261 | 227 |
| Average age of membership | 60.0 | 59.8 |
| Average pensionable service | 26.2 | 25.7 |
| Average pensionable salary | $149,231 | $140,748 |
| Expected average remaining service | 5.1 years | 5.2 years |
| Average annual pension | $49,047 | $49,929 |
Your pension plan
You participate in the defined benefit (“DB”) pension plan. When you retire, you receive a set monthly pension payment for the rest of your life.
Financial position
Going concern financial position of the plan
The financial position of the plan on a going-concern basis is measured by comparing the actuarial value of assets to the actuarial liabilities assuming the plan is continuing for the long-term.
The following table outlines the results of the actuarial valuation performed as at Dec. 31, 2025. Comparative numbers as at Dec. 31, 2024 are also provided.
| 2025 | 2024 | |
| ASSETS | ||
| Fund value (net assets available for benefits) | $162,737,000 | $165,025,000 |
| LIABILITIES | ||
| Total actuarial liabilities | $152,285,000 | $156,091,000 |
| SURPLUS | $10,452,000 | $8,934,000 |
| FUNDED RATIO (assets/liabilities) | 106.9% | 105.7% |
Contribution and funding requirements
The plan has filed a valuation report with the regulators at Dec. 31, 2025. The plan revealed a going-concern surplus of $10,452,000 and therefore no special payments are required.
The actuary has concluded that current contribution rates continue to be less than the benefits currently accruing to members of the plan. The valuation at Dec. 31, 2025 revealed a current service cost deficiency of 6.59% of pensionable earnings. However, surplus assets are sufficient to cover this deficiency; therefore, no additional contributions are required to be made to the plan.
Hypothetical wind-up position of the plan
The Pension Benefits Act (Saskatchewan) requires the university to review whether the assets of the plan would be sufficient to cover the liabilities of the plan in the event of a plan wind-up. The following table outlines the wind-up position of the plan at Dec. 31, 2025.
| 2025 | 2024 | |
| Actuarial value of assets | $162,537,000 | $164,825,000 |
| Actuarial liability | $149,964,000 | $154,865,000 |
| Surplus/(deficit)* | $12,573,000 | $9,960,000 |
| Solvency ratio (assets/liabilities) | 108.4% | 106.4% |
*The plan has been classified as a “specified plan” and is not required to fund solvency deficiencies.
Plan information
Plan Documents
Copies of the following documents are on file in the Pension office (USask Administration). They are available for inspection by any member of the plan during regular working hours by prior arrangements.
- plan text
- financial statements
- actuarial reports
- Financial Statements
- auditor’s report
- committee meeting agendas and minutes
Other Agents of the Plan
- Actuary: Aon, Saskatoon
- Investment Consultant: Aon, Calgary
- Custodian: CIBC Mellon
Committee members
Faculty Association appointees:
- Robert Roy, Agriculture and Bioresources Economics
- Gordon Sarty, Psychology and Health Studies
- Phil Chilibeck, Kinesiology
Board of Governor representatives
- Clay Benaschuk (Chair), Administration
- Ana Crespo-Martin, Faculty Relations
- Doral Johnson, Administration
Observer
- Michael Cuggy, ASPA
Committee meetings
The Academic Defined Benefit Pension Committee met three times during the year. Acting in its capacity as managing fiduciary, the Committee is responsible for the oversight of the 1999 Academic Pension Plan operations, including funding, investment, and administration of the plan. The Committee activities over the past year in fulfilling these responsibilities are outlined below.
| June 2, 2026 | 3.0 hours |
|
| March 19, 2026 | 3.0 hours |
|
| Dec. 16, 2025 | 3.0 hours |
|
| Sept. 19, 2025 | 3.0 hours |
|
2025 the year in review
Pension plan information at Dec. 31, 2025
1. Market Value of Pension Plan Assets
| Asset Classes | 2025 | Per cent |
|---|---|---|
| Non-Canadian Equities | $43,960 | 27.0% |
| Real Estate | $16,199 | 9.9% |
| Total Growth Assets | $60,159 | 36.9% |
| Cash | $394 | 0.2% |
| Long Term and Universe Bonds | $102,390 | 62.8% |
| Total Cash and Fixed Income | $102,784 | 63.1% |
| Total Market Value1 | $162,943 | |
2. Distribution of Assets Among Investment Managers
| Investment Manager | 2025 | Per cent |
|---|---|---|
| BlackRock | $102,390 | 63.0% |
| Arrowstreet | $23,915 | 14.7% |
| TD Asset Management – Epoch | $20,045 | 12.3% |
| TD Asset Management – Greystone | $16,199 | 10.0% |
| Total Market Value2 | $162,549 | |
1. Total Market Value excludes amounts in Tweedy Browne.
2. Total Market Value excludes amounts in Operating Fund and Tweedy Browne.
3. Investment Performance
The long-term investment goal of the Fund is to achieve an annualized total rate of return that supports the funded status of the Plan. This goal is consistent with the overall investment risk level that the Fund could assume in order to meet the pension obligations of the Plan, and normally will be assessed over longer time periods; i.e., ten years or more. To achieve this goal, the Plan adopted an asset mix balanced between Cash & Fixed Income Assets (i.e., Long Term Bonds, Universe Bonds, and Cash) and Growth Assets (Equities and Alternatives). The responsibility for investing the assets of the Plan is delegated to four professional investment management firms with different mandates to ensure adequate investment diversification.
The Plan’s Return Benchmark is a performance standard developed by the Plan’s Investment Consultant, Aon. The Academic Defined Benefit Pension Committee and the Board of Governors approved the benchmark. The investment managers of the Plan are expected to meet or surpass the returns of the benchmark.
| Investment performance | 2025 | Last 4 years | Last 10 years |
|---|---|---|---|
| Return* | 5.8% | 3.4% | 5.6% |
| Benchmark* | 4.6% | 3.0% | 5.8% |
*Gross of fees
4. 2025: The year in review – Market performance
The Markets
2025 was an unexpectedly strong year for global markets, characterized by resilient growth, an AI-driven tech rally, and a change in leadership with international equities outperforming U.S. equity markets. Despite trade tensions, inflation, and geopolitical issues, equities hit record highs with some markets returning over 30%, bolstered by AI and easing, though volatile, monetary policies.
In Canada, the dominant story in 2025 was a fragile economy marked by tariff uncertainty. The trade war contributed to slower full‑time hiring, supply chain disruptions and a contraction in growth in the second quarter. Even so, Canada avoided a recession and demonstrated resilience in many areas. Employment data through November and the third‑quarter GDP figures both showed a strong rebound.
Central bank policy remained a major driver of capital markets throughout 2025. Both the Bank of Canada and the U.S. Federal Reserve cut interest rates multiple times over the year. The Bank of Canada lowered its overnight rate four times (by a total of 1.00 percentage point), ending 2025 at 2.25%. The Federal Reserve reduced the federal funds rate by 0.75 percentage points, finishing the year in a range of 3.50% to 3.75%.
Equities
Public equity markets in 2025 continued to push higher following strong calendar years in 2023 and 2024. The S&P/TSX Composite was up 31.7%, the S&P 500 gained 12.4%, the MSCI World Index advanced 15.4%, and the MSCI EAFE Index rose 25.1%. However, volatility was elevated amid uncertainty surrounding tariffs and rising geopolitical conflict.
Canadian equity markets were one of the strongest markets globally. All 11 GICS sectors were positive in 2025, but materials stood out, rising 100.6%, driven by gold-related stocks as the price of gold surged. This outsized move proved challenging for institutional asset managers, who as a group tend to underweight gold stocks due to the cyclicality of their earnings and to avoid excessive concentration. As a result, many active Canadian equity strategies struggled to beat the benchmark in 2025.
U.S. equity markets experienced a volatile but ultimately positive year, returning 12.4%. Within the U.S. equity market, the story was no longer just about the “Magnificent 7”: As concerns grew over the high valuations and concentration risk associated with those big tech names, investors started diversifying into a broader range of companies, especially those with more attractive valuations.
Global equity markets outside Canada and the U.S. also delivered strong results in 2025, although returns varied by region and sector. The MSCI All Countries World Index finished the year higher in Canadian dollar terms, despite an early‑year pullback tied to the AI‑led sell‑off and tariff uncertainty. As the year progressed, sentiment improved: EAFE markets benefited from a resurgence in industrials, while emerging markets were supported by the strength of Korean and Taiwanese equities and, later in the year, renewed interest in Chinese equities.
Fixed Income
2025 was a difficult year for bonds despite central banks continuing to cut interest rates around the globe. Throughout the year, short term yields dropped in Canada as the Bank of Canada lowered interest rates while the long end of the yield curve rose. In terms of duration, medium-term bonds performed the best, generating a 4.0% return, short-duration bonds returned 3.9% and long duration bonds fell by 0.7%. Overall, the FTSE Canada Universe Bond Index returned a modest 2.6% in 2025.
Canadian Real Estate
The Canadian real estate market posted a 1.3% return in the year (MSCI/REALpac Canada Quarterly Property Fund Index). Income remained a key driver of performance in 2025 as property values continued to depreciate, however the Canadian real estate market ended the year in a cautious recovery. High mortgage renewal costs and soft consumer spending limited momentum, even as rate cuts provided partial relief. Retail was comparatively resilient, led by necessity‑based tenants and stronger performance from dominant regional centers. Industrial properties entered a normalization phase as new supply slowed and pandemic‑era demand normalized, while office conditions improved only gradually, with interest concentrated in prime Toronto assets.
5. 2025: The year in review – Plan performance
The University of Saskatchewan 1999 Academic Pension Plan delivered strong absolute returns over 2025 and outperformed its benchmark by 1.2% gross of fees. Equities were a major driver of performance. Both Arrowstreet and TDAM Epoch delivered double-digit returns and outperformed their respective benchmarks. The combined Fixed Income portfolio delivered a modest return of 1.0% in the year, matching its benchmark. Real Estate delivered a -1.5% return over the year, underperforming its benchmark by 2.8%. The Plan’s assets decreased by 1.4% in 2025 ($163m vs. $165m), gross of investment management fees and expenses. The reduction in Plan assets can be attributed entirely to net cash outflows.
| Manager | Strategy | Q1 | Q2 | Q3 | Q4 | 2025 |
|---|---|---|---|---|---|---|
| BlackRock | Canadian Fixed Income | 1.9% | -1.4% | 1.4% | -0.9% | 1.0% |
| Arrowstreet | Global Equities | 1.4% | 6.3% | 11.9% | 2.6% | 23.6% |
| TDAM - Epoch | Global Equities | 5.4% | 2.9% | 7.4% | 2.3% | 19.2% |
| TDAM - Greystone | Real Estate | -0.2% | 0.7% | -0.4% | -1.6% | -1.5% |
| Total Fund | 1.9% | 0.3% | 3.4% | 0.0% | 5.8% | |
6. 2026 Outlook
Bonds
As of mid‑2026, fixed income markets in Canada and globally have been shaped by renewed inflation pressures, geopolitical shocks and cautious central banks. The first half of 2026 was dominated by the conflict involving Iran, the US and Israel and its impact on oil prices, alongside the AI‑driven investment boom. Oil prices spiked as Middle East tensions escalated and shipping through the Strait of Hormuz was disrupted, then retreated as ceasefires were agreed. Canadian bond investors have faced volatility rather than a clear trend, with yields rising when energy‑related inflation risk dominated and easing as crude prices fell and de‑escalation gained traction.
Canada’s economy entered 2026 weakly: real GDP contracted in Q4 2025 and Q1 2026, before data for April and May signalled a rebound and an end to a (technical) recession in Q2. Labour‑market conditions were choppy, with outright job losses and unemployment rising toward 6.9% before roughly 88,000 jobs were added in May, taking unemployment back down near 6.6%. These swings reflect cyclical softness and trade‑related uncertainty, including the CUSMA review and tariffs. Inflation has been shaped by energy moves and base effects, with headline CPI at times rising, while core measures stayed more contained and, temporarily, drifted lower.
The Bank of Canada has maintained a cautious stance, keeping its policy rate at 2.25% through early‑2026 meetings and monitoring softer growth and a weaker labour market versus higher energy prices and tariff‑related supply shocks. Policymakers warn that cutting now risks future inflation if weakness reflects lower productive capacity, while also noting downside growth risks and signalling a willingness to look through near‑term, energy‑driven price spikes. With more dovish June communication, we expect an extended pause, likely with no hikes before early 2027. Government bond yields in Canada rose during episodes of elevated oil prices and conflict concerns but remain only modestly above immediate post‑pandemic levels and have retraced some increases as crude corrected and the Bank’s pause was reinforced.
Global bond markets have also digested the Middle East conflict and must adjust to the evolving stance of the US Federal Reserve under new leadership. US growth remains relatively robust, supported by loose financial conditions and strong household wealth tied to high equity prices and significant AI‑related capex, even as some labour indicators soften and core inflation remains above target. The new Fed Chair Kevin Warsh emphasizes AI’s potential to raise long‑term productivity and stressed the benefits of using real‑time data. We expect no rate cuts in 2026 and see a risk of modest tightening around December if growth remains above potential and underlying inflation persists. Over the medium term, stronger potential growth implies higher equilibrium real interest rates, suggesting global policy rates may settle above the ultra‑low pre‑2020 levels.
Credit markets have been more resilient than headline risks imply. Investment grade spreads widened during periods of heightened concern about the Gulf conflict and inflation, but stayed within long‑term historical averages and, in some cases, narrowed again as oil prices fell from March peaks and fears of a deep downturn eased. In Canada, investment grade corporate spreads rose from earlier lows but remain contained, consistent with generally sound corporate balance sheets. We remain cautious on broad public sub‑investment‑grade credit: high yield and loan spreads have moved around, loans offer somewhat more attractive spreads but are tied to lower‑quality issuers, and overall traditional high yield valuations are not especially compelling by historical standards.
We see better value where investors are compensated for illiquidity, complexity and underwriting rather than broad beta. Within private credit, we favour areas such as asset‑backed finance and credit risk‑sharing transactions with banks and other lenders, where exposure is diversified across pools of loans and underwriting focuses on collateral quality and incentive alignment. Manager selection is critical given wide dispersion between top‑ and bottom‑quartile managers, and structures aimed at retail investors have recently faced more pressure than traditional institutional vehicles. Private credit default and restructuring data do not point to a generalized crisis. For long‑term investors, high‑quality government bonds and investment grade credit now offer more strategic value than in the decade after the global financial crisis, but scope for large capital gains is limited and volatility is likely to remain elevated as markets navigate geopolitics, energy and central‑bank policy.
Equities
Equity markets in 2026 remain driven by the AI boom, a more complex geopolitical backdrop and elevated but non‑crisis inflation. Markets have absorbed shocks from the Middle East conflict and changing US tariff policy, yet major global indices have delivered positive year‑to‑date returns, supported by strong earnings in AI‑linked sectors and the absence of a feedback loop from markets to growth. The AI investment cycle is the key driver: global semiconductor sales are very high, high‑bandwidth memory prices have surged, and profits for leading chipmakers and AI‑infrastructure suppliers have risen sharply. Leadership has shifted from hyperscale cloud companies to semiconductor and equipment names, and in many areas, earnings per share have grown faster than share prices, leading to valuation multiple compression rather than expansion, unlike in classic tech bubbles.
At the US index level, valuations look expensive but not clearly in bubble territory. The S&P 500 forward P/E briefly reached the top decile of its historical range, then retreated as earnings grew and prices consolidated. While the risk of de‑rating is real if growth disappoints or AI‑related profits normalize, valuations could move higher if optimism about long‑term productivity and profitability persists. We are wary of large tactical underweights in equities based solely on valuations; instead, this is a period to revisit strategic allocations, broaden opportunity sets and build resilience through diversification across regions, styles and asset classes. The main risk is less a pure valuation bubble and more a potential “earnings bubble” in AI‑linked activities: a significant share of recent earnings growth has been driven by AI‑related “other income” and capital‑markets revenues. Constraints in construction or regulation, or a slowdown in hyperscaler spending could trigger a reassessment of AI lab valuations and large‑model revenues, turning current the support into a drag for technology and financials that have benefited indirectly.
Canadian equities are participating with distinct drivers. The S&P/TSX Composite has gained in the first half of 2026 but underperformed global equities in CAD terms. Financials and energy have been key contributors, and value has significantly outperformed growth. We do not view the Canadian market as clearly in bubble territory, though parts of financials appear to be “priced for perfection,” leaving less room for disappointment. We previously expected the TSX to see faster EPS growth than developed ex‑US markets due to energy exposure - which has partly played out - but the oil‑price spike during the Gulf crisis was followed by ceasefires and increased non‑OPEC+ production, which tempered upside. The federal government under Prime Minister Carney has adopted a more pro‑growth tone, including a multi‑year defence agenda, carbon‑price changes tied to pipeline projects and proposals to strengthen communications infrastructure. Canada’s oil sands remain a key non‑OPEC supply source, and the AI datacentre build‑out is extending into Canada, leveraging domestic energy sectors and reinforcing Canada’s role as a reliable commodity and energy supplier. These trends support capital markets activity and sectors such as infrastructure and construction, forming part of the constructive medium‑term case for Canadian banks and energy even as near‑term growth is modest.
Globally, US large‑cap technology remains central to index performance, but concentration risk persists. Outside the US, opportunities are emerging in markets tied into the AI hardware supply chain, especially in parts of Asia, and in real‑asset‑linked strategies benefiting from digital and energy infrastructure build‑outs. Together with geopolitical fragmentation, higher fiscal deficits and periodic energy shocks, this backdrop reinforces the importance of diversification, quality balance sheets, resilient cash‑flows and pricing power. Overall, we see an equity outlook of cautious optimism: the global economy has so far avoided recession despite tight monetary policy and repeated shocks, but risks from inflation, policy missteps and earnings concentration remain meaningful. We favour disciplined rebalancing, selective sector and security exposure, and thoughtful use of private markets and infrastructure to access structural themes such as AI and the energy transition.
Currencies
Currency moves in 2026 reflect rate differentials, energy‑linked terms of trade and evolving geopolitical risk. The US dollar remains the key reference, influenced by US economic strength, the Fed’s policy path and periodic spikes in uncertainty tied to the Middle East and US trade policy. Questions about US fiscal sustainability and Fed independence have become more prominent as markets assess Warsh’s appointment and the administration’s approach to fiscal‑monetary coordination.
For Canada, currency dynamics reflect commodities and relative policy expectations. Historically, higher oil prices support the Canadian dollar, and the initial Strait of Hormuz shock provided a tailwind, but subsequent oil corrections and weaker Canadian growth prospects compared to the US tempered that effect. In the first half of 2026, the Canadian dollar depreciated against most major currencies, with notable weakness versus the US dollar, euro and sterling, while periodically holding steadier against the yen amid mixed domestic data and concerns about mortgage‑refinancing pressures. We expect relative monetary policy to cap near‑term CAD strength versus USD: the Fed is likely to avoid cuts in 2026 and may tighten modestly from December if core inflation remains high, while the BoC is expected to remain on pause at 2.25% into 2027. Over the medium term, we expect CAD to appreciate versus USD, reflecting Canada’s role as a reliable supplier of energy and critical materials, expanded export capacity as new pipelines come on line, and growing AI‑linked investment in data centre and power infrastructure. As Canadian firms diversify exports toward Asia while benefiting from AI‑driven US demand, these structural forces should support the external position and currency over a multi‑year horizon, though volatility will remain.
Real Assets and Real Estate
Real assets, including real estate and infrastructure, remain important in our medium‑term allocation. The global adjustment to higher rates and changing demand is well advanced, and we see the sector closer to a bottoming‑out phase than to the start of a downturn. While offices still face challenges, several areas show improved risk‑reward profiles and strong structural demand. We favour a global, diversified real estate approach. Logistics in Europe remain undersupplied and can offer attractive returns relative to financing costs. In Canada, housing shifted from a growth driver to a drag in 2025 as higher mortgage rates and elevated prices weighed on activity. We do not expect a rapid return to earlier strength, even if lower expected policy rates will provide some support. Policy measures include a temporary federal fuel‑tax suspension and a plan to convert distressed or vacant condos into affordable, rent‑to‑own housing in British Columbia, which may modestly expand supply while easing affordability concerns.
Infrastructure is a high‑conviction area. We believe investors remain underexposed given its diversification benefits and varied return profiles. Datacentre development is now pivotal, reflecting the AI boom and the need for digital resilience. We see particular potential in pre‑contracted projects with best‑in‑class operators and high‑quality tenants, which can offer above public‑equity‑like long‑term returns while being partially de‑risked through long‑term leases. Demand from data centres and electrification is also creating opportunities in power and grid infrastructure, where essential assets and long‑term contracted revenues can support robust cash flows. As with private credit, manager and asset selection are crucial, and execution, contract discipline and attention to regulatory and environmental issues materially influence outcomes.
Commodity‑related real assets remain in focus. Commodity indices performed strongly through 2025, driven by precious metals, and in 2026 have been heavily influenced by energy‑price moves linked to the Middle East conflict. We continue to think commodities can perform well when inflation is above target and supply shocks from geopolitics or weather, including El Niño, affect production of key energy and agricultural goods. However, impacts are uneven and asset class specific, reinforcing our preference for active over purely passive exposure. Overall, we see real assets, including real estate, infrastructure and selected commodity strategies, as a useful complement to traditional equities and bonds, offering diversification, some inflation protection and exposure to themes such as AI, energy security and the energy transition. High dispersion within and across sectors argues for a global approach, careful manager and strategy selection, and clarity on each exposure’s role in the portfolio and risk budget.
7. Summary
In 2025, the U of S 1999 Academic Pension Plan again demonstrated solid performance and disciplined execution of its long-term investment strategy. The Plan achieved a 5.8% return, outperforming its benchmark by 1.2% gross of fees, supported primarily by strong global equity markets. The asset mix remains appropriate given the Plan’s liability profile and risk capacity, balancing long-term pension obligations while managing funding and investment risk with approximately 63% of assets in bonds and cash and the balance in growth assets such as non‑Canadian equities and real estate. While the Plan’s assets decreased over the year, this decline was driven entirely by net cash outflows rather than investment performance, and the Plan continued to generate returns broadly consistent with its objective of supporting the funded status over the long term.
Looking ahead to 2026 and beyond, the investment environment is expected to remain complex, shaped by renewed inflation pressures, evolving central bank policy, and an unsettled geopolitical backdrop. In fixed income, Canadian bond markets face ongoing volatility as the Bank of Canada maintains a cautious stance and investors weigh softer domestic growth, energy‑driven inflation moves, and tariff‑related uncertainty. Global bond markets are also adjusting to shifting policy under new U.S. Federal Reserve leadership, with policy rates likely to stay above the ultra‑low levels seen prior to 2020. In equities, the AI‑driven investment cycle continues to be a key driver of returns, supporting earnings in technology and related sectors even as markets digest geopolitical shocks, tariff changes, and concentration risks in a narrow group of large issuers. Canadian equities are participating in this environment with distinct sector drivers, notably in financials and energy, while global opportunities remain broad‑based across regions and styles. Real assets, including real estate and infrastructure, are moving through an adjustment phase as higher rates and changing patterns of demand are absorbed; select opportunities in logistics, infrastructure, and other real assets are expected to offer diversification and long‑term growth potential, particularly where income is supported by strong fundamentals and long‑term contracts.
Given this backdrop, the Plan may experience continued volatility, particularly within fixed income and equity portfolios, as markets respond to changing expectations for inflation, growth, and policy. Fluctuations in bond yields and credit spreads, combined with shifts in equity leadership tied to AI, trade, and energy markets, could lead to periods of elevated short‑term volatility across asset classes. Real estate and other real assets are also likely to reflect ongoing dispersion by sector and region as the impact of higher financing costs, evolving work patterns, and infrastructure demand continues to play out. The Plan’s diversified asset mix, use of multiple investment managers, and disciplined rebalancing approach will remain central to navigating these uncertainties, preserving capital, and seeking returns that support the Plan’s funded status over the long term.
Pension Administration and Support
Room E140 Administration Building
University of Saskatchewan
105 Administration Place
Saskatoon, SK S7N 5A2
(306) 966-6633
(306) 966-2036
pension@usask.ca